Tensile Testing
The Stress-Strain Graph
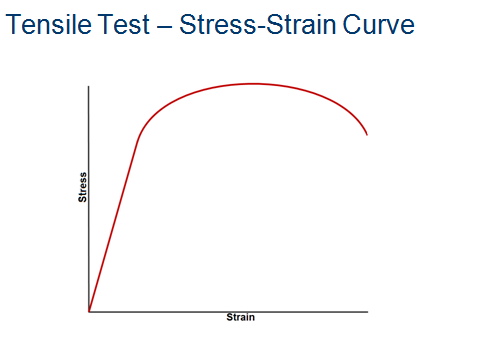
A tensile test is a standardized test used for finding the
properties for a specific material. In a tensile test, the sample material is
lathed into the shape of a ‘dog bone’ for comparing the results of other
materials. If all of the sample materials had the same shape, it’s easier for us
to compare the properties of the different materials. Most tensile testing
graphs look like the graph to the left.
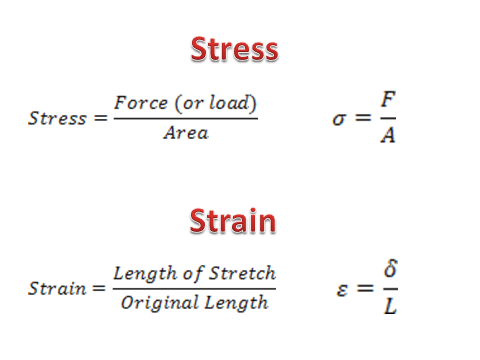
The stress is equivalent to the force divided by the area (cross-sectional area) of a material. The strain is equivalent to the deformation divided by the length of the material.
For my experiment I was given a piece of aluminum metal, and tested it using the SSA1000 machine, which pulled the aluminum piece into two other pieces. This is an example of a compression test (because the material goes under compression). I used the data from the machine and made a force divided displacement (or deformation) graph from the data.
Before I used the SSA1000 machine, I lathed my piece of aluminum into the shape of a dog bone. A material with a greater cross sectional area is more difficult to pull apart, so I made the diameter of my dog bone 0.121inches. Here I am using the lathe:

|

|
Here is the lathe machine. A lathe machine spins the material rapidly, while a stone cuts into the material to make it thinner.

To the left of the dog bone is the stone that cuts into the aluminum. Near the top of the photograph is the threaded part of the lathe that spins the material. After I finished using the machine, I took this photograph.
After using the lathe machine, I went to break the dog bone. Here is my dog bone in the SSA1000 machine:
After using the lathe machine, I went to break the dog bone. Here is my dog bone in the SSA1000 machine:

Here is the dog bone in the machine, before the test.

Here is my dog bone after the test, still inside the machine.
After I finished the testing, it was time to calculate the data. If I wanted to make sure that the material was truly aluminum, I would have to find the modulus of elasticity. If you don’t know what the modulus of elasticity is, here’s my other webpage: http://alexanderrt.weebly.com/deflection-lab.html
Before we find the modulus of elasticity, we need to know the stress and strain of the material during the test.
Like I mentioned earlier, here are the formulas for stress and strain:
Before I calculate anything, let me remind you about the basics of the tensile testing graph and the stress/strain curve.
When the material experiences the increasing load, the first section of curve will be linear. This will end at the point called the elastic limit. The line itself is the elastic range or the proportional limit. This is the where we calculate the modulus of elasticity. If the material experiences any load up to the elastic limit, the material will return to its original shape. The material is elastic or recoverable when it returns to its original shape.
When the material experiences the increasing load, the first section of curve will be linear. This will end at the point called the elastic limit. The line itself is the elastic range or the proportional limit. This is the where we calculate the modulus of elasticity. If the material experiences any load up to the elastic limit, the material will return to its original shape. The material is elastic or recoverable when it returns to its original shape.

The modulus of resilience is the area under the line up to the elastic limit. The modulus of resilience shows how much energy a material can absorb without deforming. This is why car designers would find this important; it would make it easier to design a car bumper if they understood the modulus of resilience of a material. The point after the elastic limit is the yield point, and anything after this point is deformation or failure. The small increase in strain creates a greater increase in stress. The material won’t return to its original shape at the yield point and every point after.
The material becomes stronger after the yield point. As the load increases, the weakest part of the material becomes stretched, the molecules become denser. As the load continues to increase, the stretched molecules become more stretched and even denser. Finally, as the stress-strain curve nears its peak, the decreasing area overcomes the increasing strength.
At this point, the material begins to neck. Here is the ‘necking’ for this metal:
At this point, the material begins to neck. Here is the ‘necking’ for this metal:

After the necking, the material will finally rupture or break. The ductility of a material is how much the material can be elongated before it breaks.


The material to the left is the most elastic or tough of the materials in the three photographs. The material in the middle has the toughness and brittleness of the other two materials. The material to the right is the most brittle of the material. The most ductile material is the material on the left because it’s tougher, and it’s more elastic than the other materials. This is what I mean by ‘tough’:

The area under the stress-strain curve is greater in a more elastic material. A more brittle material would have a smaller area under the stress-strain curve.

The material to the left is the tougher material; the material to the right is the more brittle material.
The compression test in the SSA1000 machine gave me an excel spreadsheet. This spreadsheet contained all of my data, and where I found the points on my stress-strain tensile testing curve. Here are the graphs:
The compression test in the SSA1000 machine gave me an excel spreadsheet. This spreadsheet contained all of my data, and where I found the points on my stress-strain tensile testing curve. Here are the graphs:


The length of my dog bone was 1 1/8” before the test, but after the test the length was 1 3/16”. Subtracting the two, I get 1/16 or .0625”. Using the formulas above, we can find the stain for the entire graph. So, .0625” (deformation) divided by 1.125” (original length) is equal to .05. The percent of elongation for this test was 5%.
Now we find the cross-sectional area of the dog bone:
Now we find the cross-sectional area of the dog bone:
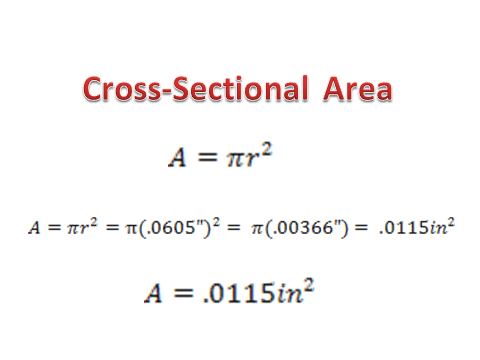
After we found the area, we can now calculate the points of the curve.

For the calculations above, I found the stress of the proportionality limit; this is the most amount of stress the material can take before it can’t return to its original shape.
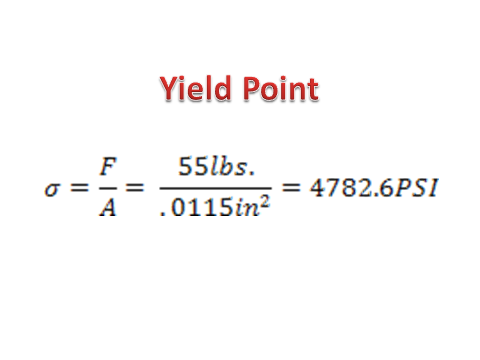
For the yield point, I approximated the value by making the force slightly larger. For the yield point and every other point after, the material is deformed. The amount of stress above is the approximated minimum amount of stress that the material cannot withstand, and as a result, the material becomes deformed.

In the calculations above, I solved the maximum amount of stress the material experienced during the test.

Here is the amount of stress experienced when the material finally fractured.
Now I need to find the modulus of elasticity for aluminum. We can find the modulus of elasticity of aluminum by subtracting forces of the start of the test to the proportionality limit and multiplying this by the original length. Then we subtract the deformation of the start of the test to the proportionality limit, and multiply them together. Then we simply divide the force x original length by the deformation x area.
Here are the calculations:
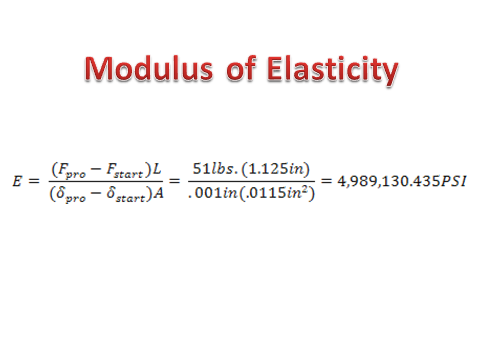
We can only calculate the modulus of elasticity at the proportionality limit because after the material becomes deformed, the modulus of elasticity will also change.
Let’s calculate the modulus of resilience:
Let’s calculate the modulus of resilience:

The modulus of resilience is the area of a triangle because the points up to the proportional limit are linear.
Now that I have calculated the modulus of elasticity and the modulus of resilience, I will now calculate the modulus of toughness:
Now that I have calculated the modulus of elasticity and the modulus of resilience, I will now calculate the modulus of toughness:
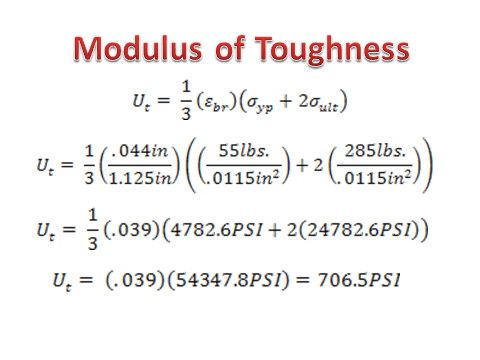
Finding the modulus of toughness is finding the total area under the stress-strain curve. In the formula above, one third is multiplied to the breaking point strain; this is multiplied to the quantity of the yield point stress added to 2 multiplied to the maximum stress.
Today I have told you about the modulus of elasticity, modulus of resilience, modulus of toughness, and their formulas. I have also told you about the stress-strain curve.
Tensile testing is very important to engineering and understanding the material world around us. Understanding material testing can help us unlock the gate to a world of limitless possibilities.
